National
Weather
Service
Training
Center
Basic Hydrologic Concepts
Answer Key
Section I
Exercise 1
a) (1.43 inch) x (1 ft/12 in) x (43,560 sq ft/1 acre) x (640 acre/sq mi) x (254 sq mi) = 844,000,000 cu ft
b) (844,000,000 cu ft) x (1 cfs-day/86,400 cu ft) = 976.85 cfs-day
c) (844,000,000 cu ft) x (1 acre/43,560 sq ft) = 19,375 acre-ft
Return to Section I, Exercise 1
Exercise 2
a) 700 + 4,800 + 3,100 + 2,020 + 1,310 cfs = 11,930 cfs ... or ... 11,930 cfs/5 days = 2,386 cfs
b) 700 + 4,800 + 3,100 + 2,020 + 1,310 cfs = 11,930 cfs-day
c) (11,930 cfs-day) x (86,400 cu ft/cfs-day) x (1 acre-ft/43,560 cu ft) = 23,663 acre-ft
d) (11,930 cfs-day/26.9 cfs-day) / (756 sq mi) = 0.58 inches/sq mi of runoff
Return to Section I, Exercise 2
Section II

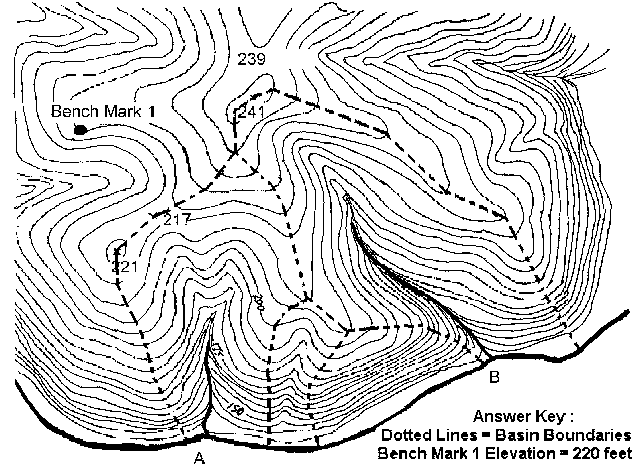
Return to Section II
Section III
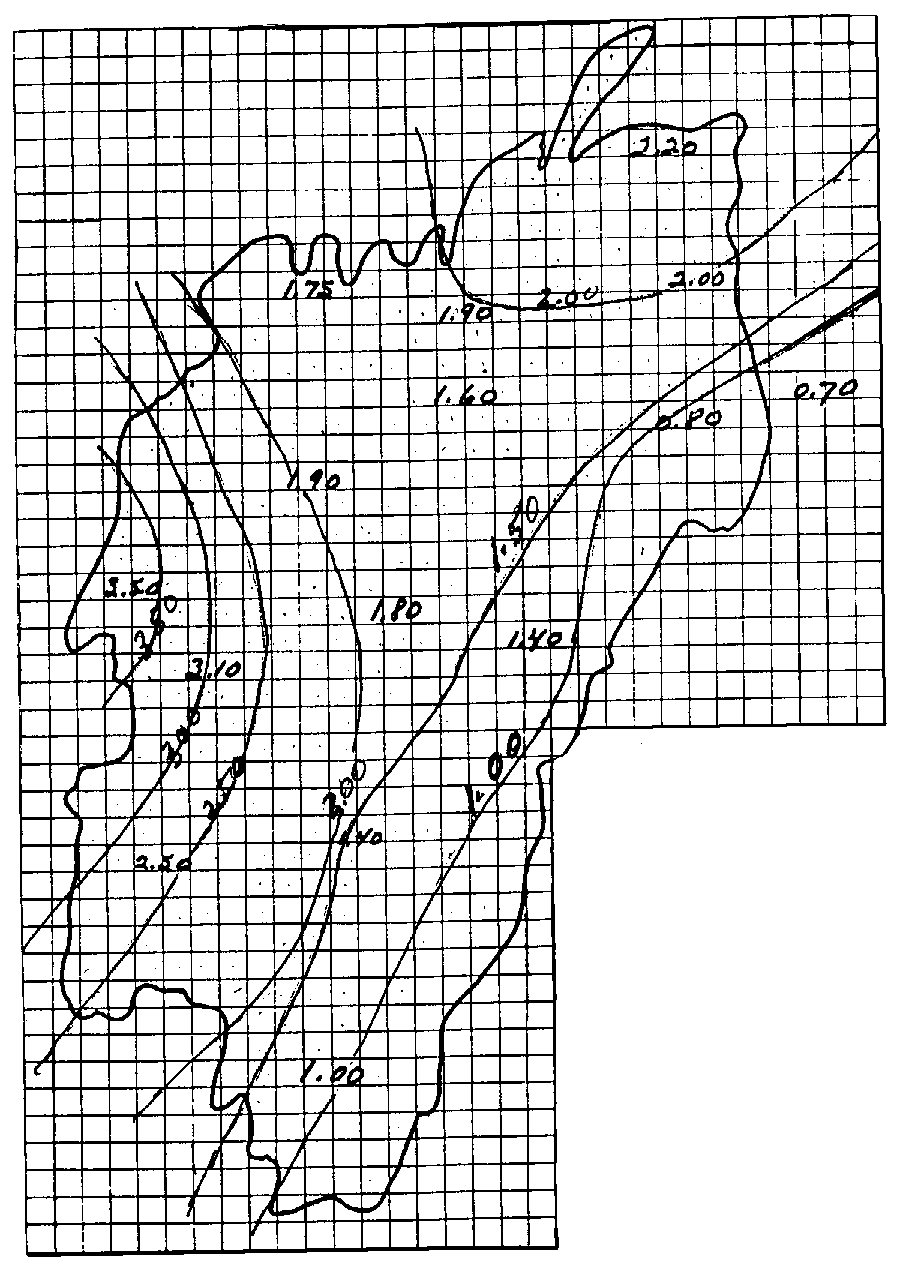
Results for Isohyet Method

Isohyet |
Average Precip |
Net Area |
Net Average Volume |
3.50" |
3.5" |
14 |
49 |
3.00" |
3.1" |
34 |
105 |
2.00" |
2.2" |
148 |
326 |
1.50" |
1.8" |
169 |
304 |
1.00" |
1.0" |
85 |
85 |
<1.00" |
0.8" |
81 |
65 |
* |
Totals |
531 |
934 |
To compute the mean areal precipitation, divide the Net Average Volume by the Net Area: 934/531 = 1.76
Basin Mean Areal Precipitation is 1.76 inches
** Your answer should be close, but may not be exactly the same **
Return to Section III
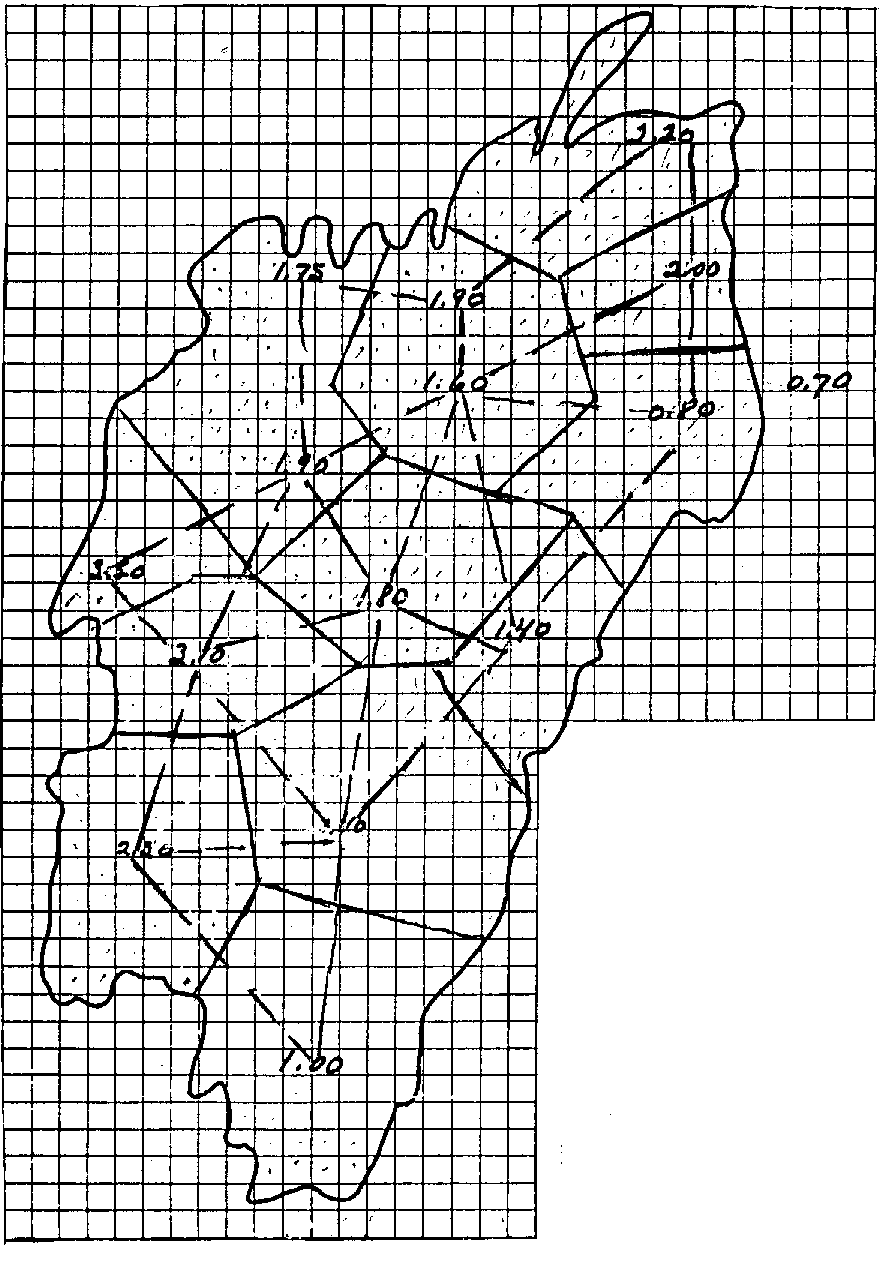
Results for Theissen Method

Observed Area (count squares) |
% x |
Precip Amounts = |
Total |
24 |
0.04 |
2.20 |
0.09 |
26 |
0.04 |
2.00 |
0.08 |
40 |
0.07 |
0.80 |
0.06 |
36+56 (Total area=1.90) |
0.16 |
1.90 |
0.30 |
42 |
0.07 |
1.60 |
0.11 |
69+28 (Total area=1.40) |
0.17 |
1.40 |
0.24 |
32 |
0.05 |
1.75 |
0.09 |
44 |
0.08 |
1.80 |
0.14 |
70 |
0.12 |
1.00 |
0.12 |
22 |
0.04 |
3.50 |
0.14 |
32 |
0.06 |
3.10 |
0.19 |
56 |
0.10 |
2.50 |
0.25 |
Total Area = 577 |
100 |
Answer = |
1.81 inches |
** Your answer should be close, but may not be exactly the same **
Return to Section III
Section IV
Rainfall/ Runoff Relationships
API Exercise/Questions:
Question 1: 2.8 inches
Question 2: 2.0 inches
Question 3: 4.0 inches
Question 4: 1.5 inches
Question 5: As the rainfall increases, a higher percentage of rainfall will become surface runoff.
Typical Infiltration Rates/Soil Groups
Answers
a) Clays, clay loam
b) Sandy soils
Return to Section IV
Section V
Unit Hydrographs
Effect of Storm and Basin Characteristics on Hydrograph Shapes
Answers
1) Rain near top of basin
Rain near bottom of basin
Shape and tributaries near bottom of basin
Shape and tributaries near top of basin
Return to Example 1 of Section V
2) Fanlike shape with larger area; less tributaries
Return to Example 2 of Section V
3) Elongated/several short tributaries connecting to mainstem
Return to Example 3 of Section V
4) Pear shape with less number of tributaries
Return to Example 4 of Section V
5) Glove shape a smaller basin connecting to a mainstem; multiple crests
Return to Example 5 of Section V
Return to top of "Effects" segment of Section V
Section VI
Rating Curves and Streamflow Measurements
Question 1: no, flood stage is 20 feet
Question 2: 17,500 cfs
Return to Section VI
Updated 07/25/07