National
Weather
Service
Training
Center
Basic Hydrology Concepts
Section V
Unit Hydrographs
Introduction
Unit hydrograph theory converts runoff values for a basin into flow or discharge at the basin outlet.
Lesson Objectives
Upon completion of this lesson, you should be able to explain unit hydrograph theory and to define the components of a storm hydrograph. Specifically, at the conclusion of this lesson, you should be able to:
- Explain the unit hydrograph concept.
- Define the unit duration of a unit hydrograph.
- List the assumptions used in unit hydrograph theory.
- Describe the difference between a storm hydrograph and a unit hydrograph.
- Explain how an observed storm hydrograph will differ from a forecast hydrograph when the assumptions of unit hydrograph theory are not met.
Unit Hydrographs
Rainfall reaching the ground will infiltrate the soil or it will remain on the soil surface and move by gravity overland to a stream channel. Water infiltrating into the soil may percolate slowly down to the groundwater or it may move laterally through the soil and eventually reach the stream. This lateral flow, called baseflow, takes weeks or months for water to reach the stream channel. Water on the soil surface that travels overland to the stream channel plus rainfall directly on the stream bed is referred to as surface or direct runoff and generally reaches the stream channel very rapidly.
Baseflow changes very slowly and makes up only a small portion of streamflow during a flood. The largest percentage of floodwater is generally surface runoff. The estimation of surface runoff and the resultant flow at the basin outlet is critical in the forecasting of floods. Rainfall/runoff techniques such as Antecedent Precipitation Index (API) or the Sacramento Soil Moisture Accounting (SACSMA) determine the amount of runoff to be expected from a basin from a given rainfall amount. The unit hydrograph makes the conversion from runoff amount or depth to streamflow discharge. The flow from a unit hydrograph added to an estimate of baseflow determines the total amount of discharge past a point.
Storm Hydrograph - A hydrograph representing the total flow or discharge past a point
Unit Hydrograph - A unit hydrograph represents the hydrograph from direct or surface runoff from one inch of runoff over the entire basin in a given unit of time.
Unit Hydrograph Theory - Unit hydrograph theory states that surface runoff Hydrographs for storms of the same duration will have the same shape, and the ordinates of the hydrograph will be proportional to the ordinates of the unit hydrograph. For example, the hydrograph ordinates from one half inch of runoff will be half of the ordinates of a unit hydrograph.
Assumptions in Unit Hydrograph Theory
Unit hydrograph theory makes the following assumptions:
- Rainfall is evenly distributed in space and time for all storms
- The basin is relatively homogenous
Engineers develop unit hydrographs for specific runoff durations. For different runoff durations, the unit hydrograph will be different. For time durations of runoff that are close, the error in unit hydrographs is negligible. Most unit hydrographs for the NWS are either three or six hour durations.
Procedure Used in Unit Hydrograph Theory
Unit hydrograph theory uses the following procedure:
- Develop a unit hydrograph for a basin using a series of storm hydrographs of similar duration.
- Use the derived unit hydrograph in the hydrologic model.
- When a runoff event occurs, a method used to estimate the amount of surface runoff from a basin.
- Estimate baseflow.
- Convert surface runoff discharge to discharge at the basin outlet using unit hydrograph theory and the previously derived unit hydrograph.
- Add the estimate of baseflow to the estimate of discharge from the unit hydrograph procedure to determine a forecasted storm hydrograph.
Often, the assumptions of unit hydrograph theory are unmet. When assumptions are not met, the observed hydrograph will vary from the forecasted hydrograph computed using unit hydrograph theory. These differences will result when the following occur:
Duration of rainfall is different - If the rainfall occurs in a significantly shorter period than the duration of the unit hydrograph, the peak flow will be higher and occur sooner than that forecasted using unit hydrograph theory. This may occur when a highly convective storm produces runoff for one hour but the NWS forecast models are limited to 6-hour durations.
Areal distribution of rainfall and runoff - If the heaviest rainfall and resultant runoff occurs near the basin outlet, the resulting forecasted hydrograph will peak higher and rise sooner than a forecasted hydrograph from unit hydrograph theory. If the heaviest rainfall and resulting runoff occurs in the upper ends of the basin, the peak will occur later and be less than that forecasted using unit hydrograph theory.
Rainfall intensity - Periods of short intense rainfall imbedded in a general storm may generate spikes in a hydrograph.
Storm movement - If a storm moves from the headwaters of a basin to the basin outlet, the resulting hydrograph will peak higher and occur sooner than forecasted using unit hydrograph theory. If the storm movement is from the basin outlet to the headwaters, the forecasted storm hydrograph will peak later and the peak will be less than those forecasted using unit hydrograph theory.
Sample Problem
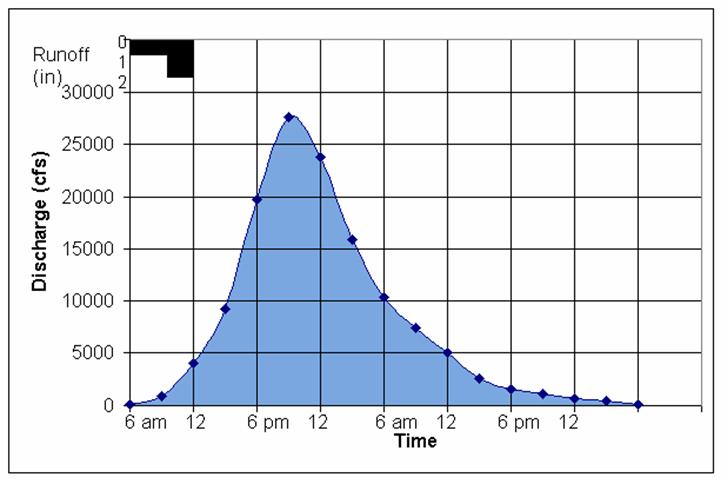
A forecast model run at 12 noon estimated runoff from 6 A.M. to 9 A.M. to be 0.5 inches and 1.5 inches from 9 A.M. to noon. Assume the base flow for the basin is constant at 100 cfs. Forecast the magnitude and time of the peak flow using unit hydrograph theory and the unit hydrograph listed. To compute the storm hydrograph, compute each element and add together the components of base flow, flow from surface runoff from 6 A.M. to 9 A.M., and the flow from surface runoff from 9 A.M. to noon. These results are shown at the below. The first row is the base flow estimated to be 100 cfs. The second row is the flow because of 0.5 inches of runoff from 6-9 A.M. Each ordinate is half of the corresponding UHG ordinate as specified by unit hydrograph theory. The first ordinate at the beginning of the rainfall at 6 A.M. is zero. The third row is the flow from 1.5 inches of runoff from 9 A.M. to noon and is 1.5 times the ordinates of the UHG. The storm hydrograph is the sum of the first three rows. See the plot of results above the tabulations. The peak flow should occur about 9 P.M. on the day the rain occurs and should be about 28,000 cfs.
FIGURE: Unit Hydrograph Ordinates
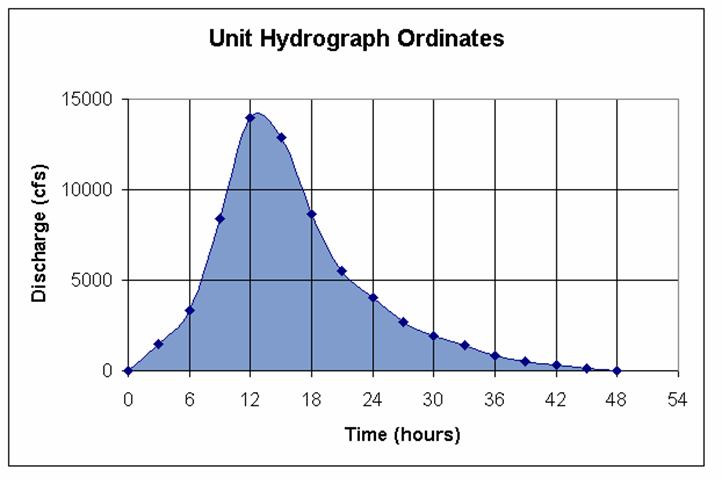
Time since rain began (hours) |
Discharge (cfs) |
0 |
0 |
3 |
1500 |
6 |
3300 |
9 |
8400 |
12 |
14000 |
15 |
12900 |
18 |
8700 |
21 |
5500 |
24 |
4000 |
27 |
2700 |
30 |
1900 |
33 |
1400 |
36 |
800 |
39 |
500 |
42 |
300 |
45 |
150 |
48 |
0 |
Since base flow usually comprises a small percentage of flood flows and it occurs very slowly, the accurate prediction of the amount and time distribution of surface runoff should yield an acceptably accurate prediction of flood peak flows.
Using the Antecedent Precipitation Index (API) method or the Sacramento Soil Moisture Accounting Model (SACSMA), surface runoff may be estimated; and using the hydrograph theory, the hydrograph at a gaging point resulting from the surface runoff can be computed.
Determine total flow (or storm hydrograph) at the gaging site by adding flow from surface runoff to the estimate of base flow.
RFCs must use hydrographs to compute or predict the storm hydrograph for a gaging site. RFCs generally develop a unit hydrograph for each basin in their area and enter these into the RFCs hydrograph models when the models are setup. During each subsequent model run, use the unit hydrograph to convert surface runoff (computed using the SACSMA model or an API model) to streamflow.
Combine flow from surface runoff with an estimate of base flow to compute a storm hydrograph. For successive periods, add the flow computed from surface runoff to base flow and the flow from surface runoff in previous periods.
FIGURE: Unit Hydrograph Ordinates with Rainfall
6 am |
9 am |
Noon |
3 pm |
6 pm |
9 pm |
Mid |
3 am |
6 am |
|
Base flow |
100 |
100 |
100 |
100 |
100 |
100 |
100 |
100 |
100 |
0.5” RO (6-9 am) |
0 |
750 |
1650 |
4200 |
7000 |
6450 |
4350 |
2750 |
2000 |
1.5” RO (9-12) |
-- |
0 |
2250 |
4950 |
12600 |
21000 |
19350 |
13050 |
8250 |
Total flow |
100 |
850 |
4000 |
9250 |
19700 |
27550 |
23800 |
15900 |
10350 |
9 am |
Noon |
3 pm |
6 pm |
9 pm |
Mid |
3 am |
6 am |
9 am |
|
Base flow |
100 |
100 |
100 |
100 |
100 |
100 |
100 |
100 |
100 |
0.5” RO (6-9 am) |
1350 |
950 |
700 |
400 |
250 |
250 |
150 |
75 |
0 |
1.5” RO (9-12) |
6000 |
4040 |
2850 |
2100 |
1200 |
750 |
450 |
225 |
0 |
Total flow |
7450 |
5090 |
3650 |
2600 |
1550 |
1100 |
700 |
400 |
100 |
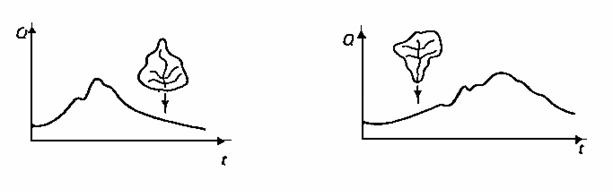
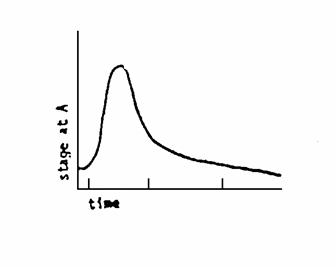
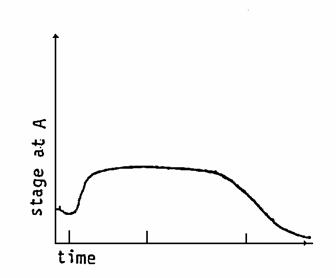
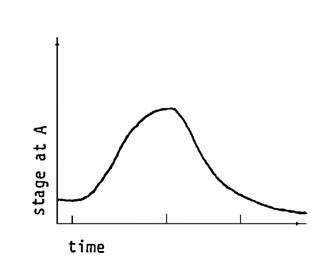
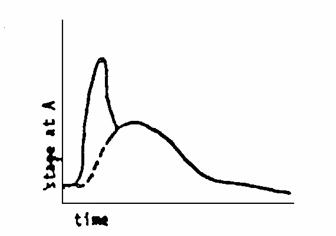
Effect of Storm and Basin Characteristics on Hydrograph Shape
Assume that storm movement and storm duration is the same for the following basins and hydrographs. Also, assume that these basins are similar in soil and topographic characteristics.
What characteristics make the hydrographs shapes different?
Hint: Review the section above on what happens when unit hydrograph assumptions are not met.
Example 1
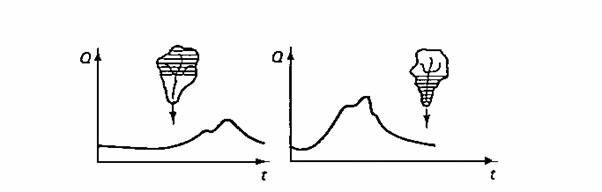
Example 2
Example 3
Example 4
Example 5
The problem of forecasting stage becomes more difficult when there are multiple crests because of irregularly shaped basins.
Factors Affecting Flood Forecasts
The example shows you how to interpret the chart below.
Example: as soil moisture trends to increase
- runoff will increase
- infiltration rate will decrease
- crest height will decrease
- timing will be earlier
Return to the Basic Hydrologic Concepts Menu of Lessons.
Updated 07/17/07