National
Weather
Service
Training
Center
Basic Hydrologic Concepts
Section VI
Rating Curves and Streamflow Measurements
Introduction
Streamflow is the flow of water past a point per unit time. Streamflow is normally determined indirectly by measuring the stage. Forecasters use rating curves or tables to convert the stage to discharge.
Lesson Objectives
Upon completion of this module, be able to explain the procedure to measure stage, and convert stage to discharge. Specifically, at the conclusion of this lesson, the forecaster should be able to:
· Define stage, gage datum, rating curve, and rating table
· Define the steps to develop a rating curve and table
· Convert the stage at a point to discharge
Rating Curves and Streamflow
Streamflow is the flow or discharge past a point per a unit time. Streamflow is measured in units of volume per time or cubic feet per second (cfs). The direct measurement of streamflow involves using a water velocity meter and measuring the velocity of water in a channel at various locations. The measured velocities are used to compute the average velocity. Use the following relationship to convert average velocity to discharge.
Q = A x V
Where:
· Q = discharge
· A = cross-sectional area of channel
· V = average velocity
Direct measurement of streamflow is time consuming and labor intensive and does not lend itself to continuous recording. A relationship between a series of discharge measurements and corresponding stages (height above a specified datum) can be developed making it possible to measure the stage and then convert to discharge. The graph of this relationship is a rating curve. A rating table is the same data except in tabular format.
Stage is the level of the
water surface above a given datum at a given location. The datum is chosen so that all stages are greater than zero. The datum is also called gage zero. (The control for the
The relationship between stage and discharge is not linear. A rating curve will usually plot as a straight line on log-log paper and will be parabolic shaped when plotted on a linear scale. At low flows, a change in stage of one foot may result in a change in discharge of only 200 cfs. At high stages and flows, a one-foot change in stage may result in a change in discharge of 20,000 - 30,000 feet, or more.
Rating Curve Development
Rating curves are developed by the U.S. Geological Survey (USGS) and other agencies. They will make a series of streamflow measurements using a current meter. These points are plotted versus the accompanying stage. Draw a smooth curve through the points. There can be significant scatter around the points on the curve. When using a rating curve, remember:
1. Since there can be some scatter around the curve, the discharge read from the rating curve is the most likely value and could be slightly different from the measured discharge.
2. Rating curves are developed with few stage/discharge measurements at high flows. There can be significant errors in rating curves at the higher levels.
3. During flood events, the USGS and other agencies may go out, make a discharge measurement, and supply that to the NWS. This measurement adjusts the rating curves.
Example of a Rating Curve
Questions
Question: Is flood stage reached at 15 feet?
Question: What is the discharge at 15 feet?
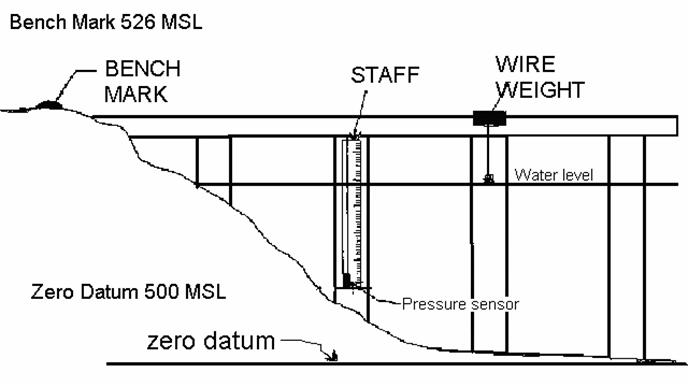
Example of the benchmark-zero datum relationship
Bench Mark: known elevation of 526 MSL (above mean sea level in feet)
Zero Datum: 500 MSL (elevation difference between benchmark and zero datum is 26 feet)
Zero datum is an arbitrary datum plane selected for the convenience of using gage heights of relatively low numbers. To eliminate the possibility of minus values of gage height, the datum selected for operating purposes is below the elevation of zero flow for all water conditions. However, some locations still may read negative numbers.
Example of an E-19
The information discussed above is on the E-19 form for every hydrologic station.
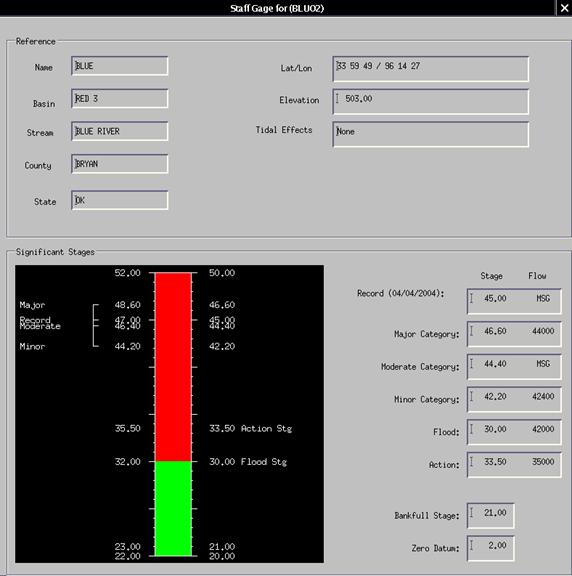
AWIPS WHFS
The AWIPS WFO Hydrologic Forecast System (WHFS) uses information from the E-19. This information is readily available to any AWIPS user. The image below is an example of how this type of data displayed in WHFS. Examples of zero datum, bank full stage, action, and flood stages are shown, including minor, moderate, major flooding elevations at a station are shown.
Return to the Basic Hydrologic Concepts Menu of Lessons
Updated 07/18/07