Choose appropriate answers:
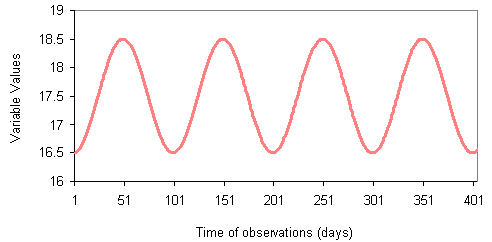
1. Please review the time series shown in the figure below and determine the period and frequency of the time series
 |
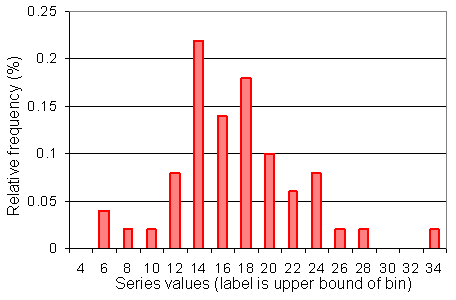
2. Figure below shows a histogram of a time series. The time series statistics are mean= 16.15, median=15.3, mode=16.2, standard deviation=5.2, skewness=0.645 , kurtosis=1.258. Choose which answer is true.
 |
3. Climatological tercile limits of a time series shown in Table below are 5.5 and 9. What is the distribution between below, near and above normal classes for the 15 years of the time series data?
| year |
1981
|
1982
|
1983
|
1984
|
1985
|
1986
|
1987
|
1988
|
1989
|
1990
|
1991
|
1992
|
1993
|
1994
|
1995
|
| value |
3
|
12
|
10
|
7
|
7.5
|
0
|
8
|
2
|
2.6
|
5
|
10
|
10.7
|
15
|
3.2
|
5
|