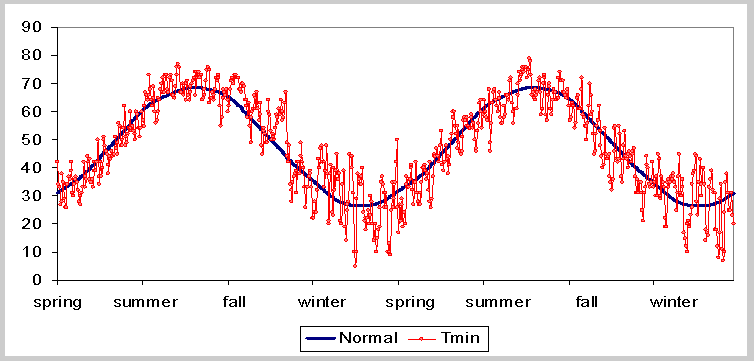
Temperature series (Figure 1) contain episodes of high and low values. Earlier we called these episodes seasons. About every 365 days or 1 year or fourth season the values in temperature series reach about the same magnitude. The time elapsed between two values of the same magnitude is defined as the period of a cycle. This temperature series is dominated by the annual cycle with a period of 1 year or 365 days.
 |
|
Figure
1. Daily Minimum Temperature for 2 years at Central park, NY and
fitted sin curve
|
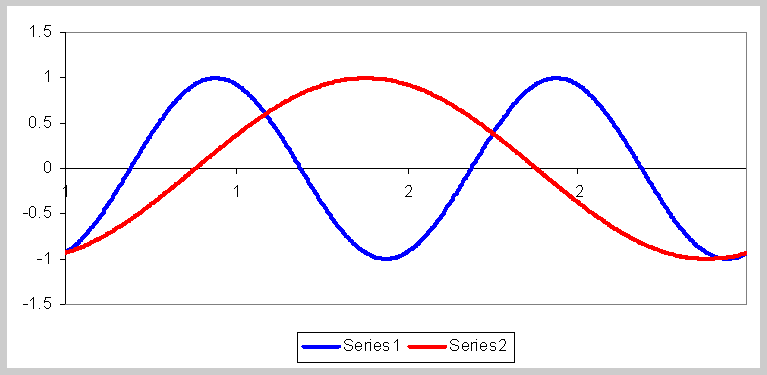
The number indicating how many repetitions of a cycle occur per time interval is called the frequency. Figure 2 shows two sin series that are similar to temperature series. Series 1 has the same period (1 year) as the dominate period of the temperature series, whereas series two has a period of 2 years. Frequency of series 1 is two cycles per two years (1 cycle a year), and of series 2 one cycle per two years.
 |
|
Figure
2. Two sin series with periods 365 (series 1) and 730 (series 2).
|
In statistics terms frequency has another meaning related to probability (so called Frequency Interpretation, Wilks, 1995). In this case frequency is interpreted as the number of observations in a certain range, category, or type.
REFERENCE:
Wilks, D.S.,1995. Statistical Methods in the Atmospheric Sciences. An Introduction. Academic Press, Inc., Pages 9-1 and 325- 333.