Histogram is a graphical display of the data distribution between non-overlapping intervals within the range of the data consisting of the count (or number) of values that fall into each interval.
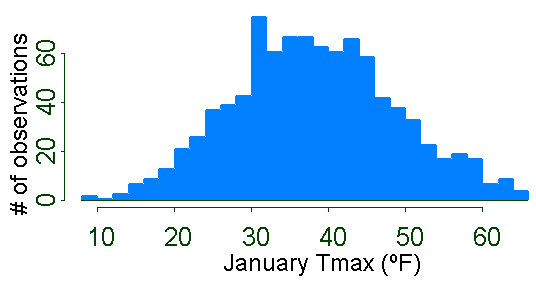 |
| Figure 1. Histogram of January Tmax at Central Park, NY. Each temperature bin is 2 degrees F. Height of the bars equals the number of observations that fall in each 2 degree temperature interval. |
These counts can be divided by the total number to give a relative frequency of occurrence. Bars are plotted with height proportional to the relative frequencies.
REFERENCE:
von Storch, H., and Zwiers, F.W., 1999. Statistical Analysis in Climate Research. Cambridge University Press. Pages 80-81.