If each observation in a climate series is xi when i changes from 1 to n (the total number of observations), then:
| Statistic | Definition | Formula |
| Central Moments | the expected values of the difference between a random variable and its expected value raised to a power (the moment number). | |
| Mean | the statistic that measures the center of a sample of data (the first central moment) by adding up the observations and dividing by the number of data points. It may be thought of as the center of mass or balancing point for the data, i.e., that point at which a ruler would balance if all the data values were placed along it at their appropriate numerical values. | 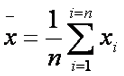 |
| Variance | the second central moment, and is a scale parameter of the variable distribution | 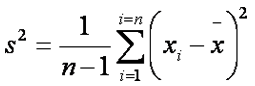 |
| Standard Deviation | is positive square root of variance | |
| Median | a statistic which measures the center of a set of data by finding that value which divides the data in half. A technical definition is that the median is the value which is greater than or equal to half of the values in the data set and less than or equal to half the values. | 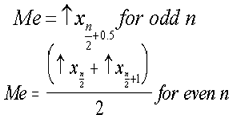 |
| Mode | a statistic defined as the most frequently occurring data value. It is sometimes used as an alternative to the mean or median as a measure of central tendency | no text |
| Terciles | are the statistics which divide the observations in a numeric sample into 3 intervals, each containing 33.333% of the data. The lower, middle, and upper terciles are computed by ordering the data from smallest to largest and then finding the values below which fall 1/3 and 2/3 of the data. | no text |
| Skewness | the third central moment of a random variable. This statistic measures symmetry of the variable distribution. If the variable has more numerous lower values skewness is negative, for more numerous high values skewness is positive. Skewness close to zero implies a symmetrical distribution | 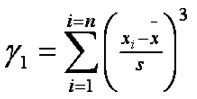 |
| Kurtosis | the fourth central moment characterizes how peaked (positive kurtosis or leptokurtic) or flat (negative kurtosis or platykurtic) the distribution is. Kurtosis close to zero is for a balanced distribution with regard to peakedness. | 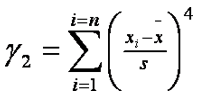 |
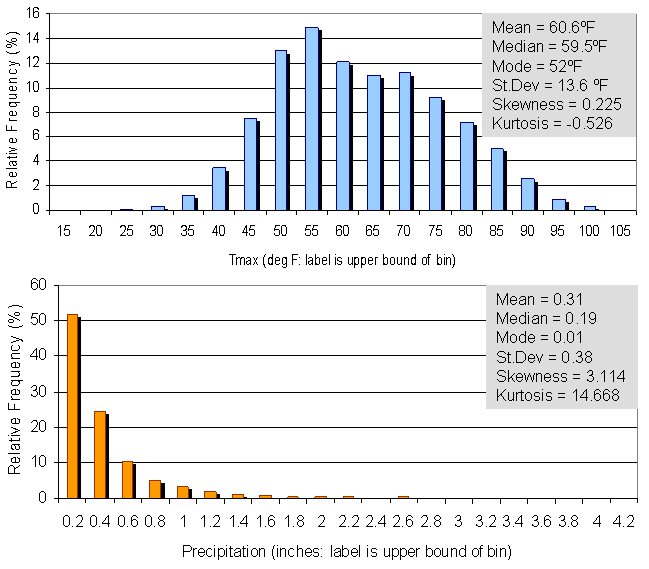 |
| Figure 1. Histograms and basic statistics for daily temperature (top) and precipitation (bottom) at Olympia Airport, Washington. |
Example of computation of basic statistics and histograms is shown in Figure 1. Temperature (Figure 1 top) mean, median and mode are very similar to each other relative to their magnitude, which is one of the characteristics of symmetric bell shaped histograms. Skewness and kurtosis statistics reflect this as well. Precipitation histogram (Figure 1 bottom) displays distinct positive skewness and kurtosis, the mean is much greater than the median relative to their magnitude, and the two are much greater than the mode.
REFERENCE
von Storch, H., and Zwiers,
F.W., 1999. Statistical Analysis in Climate Research. Cambridge University
Press.
Wilks, D.S., 1995. Statistical Methods in the Atmospheric Sciences. Academic
Press