Probability distributions are widely used in climate prediction. The most basic application is definition of class limits for defining forecast categories. NWS/NCEP Climate Prediction Center uses equally probable terciles (below, near and above normal) from the 1971-2000 series as climatological class limits. Figure 1 shows example for this.
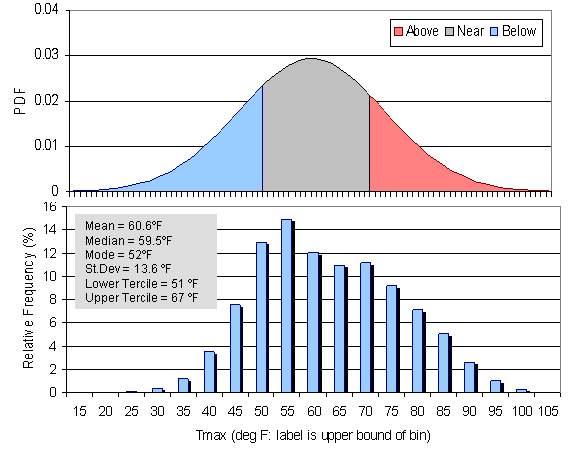 |
| Figure 1. Equally probable terciles (top) for daily temperature data (bottom) at Olympia Airport, Washington |
Tercile limits divide the data into three equal pools (relative frequency of data to fall in each class is equal to 1/3). The area under the curve of the PDF is equal to 0.33 (equal chance) for each the three bins. This Figure 1 example shows a slightly shifted lower bin (the below normal class) as the mode deviates from the distribution mean.
REFERENCE:
http://www.cpc.ncep.noaa.gov/pacdir/NFORdir/INTR.html