Suppose we compute correlations between two variables where at least one is referenced to a point on a map (like station temperature). If these are computed at many points they can be mapped, like in Figure 1 to show the spatial variability in the correlations.
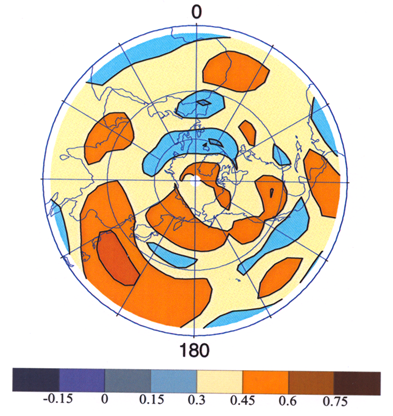 |
| Figure 1. Spatial variability of correlation between observed Week 2 200 mb streamfunction anomalies and those predicted by a model . High positive correlation (brown colors) indicates high confidence in the modeled values. Picture courtesy of Prashant Sardeshmukh, CDC/OAR |
For some studies correlations are computed between a variable external to a map and another variable at every point on a map. An example is El Nino index correlated with 500 hPa at every point on a Northern Hemisphere grid. In some other studies the map correlations are between a variable at a particular point on a map (the base point) and the same variable at every other point on the map. These correlations are examples of cross-correlations. Their map (an example is Figure 2) is sometimes called a one-point teleconnection map. The base point will have a correlation of 1 because the variable is correlated with itself at zero lag.
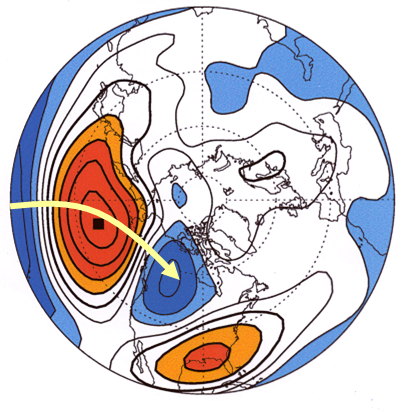 |
| Picture 2. Spatial distribution of correlation of the 500 Mb geopotential height anomaly time series (Seasonal JFM) at all points on the Northern hemisphere with the time series at a specified “base point” - North Pacific. Red colors positive correlation, blue colors negative correlation. Yellow arrow indicate meridional orientation of spatial structure existing in the correlation pattern. Picture courtesy of Prashant Sardeshmukh, CDC/OAR |
Aside: We can apply the idea of correlation to the linear relationship between two maps at one time, but now the means are averages over the maps and the products in Equation 1 are between matched up points of the two maps. This is referred to as the spatial or map correlation. When the two maps are of departures from climate normals the correlation is referred to as the anomaly correlation.