Cross correlation refers to correlation between two different variables at different locations. This type of correlation is often used in developing a model that uses one variable as a linear predictor for another variable. Examples of this correlation type are shown in Figure 1 for temperature for CPC climate divisions 76 and 67 (x-axes) to predict temperature for climate division 92 (y-axes)
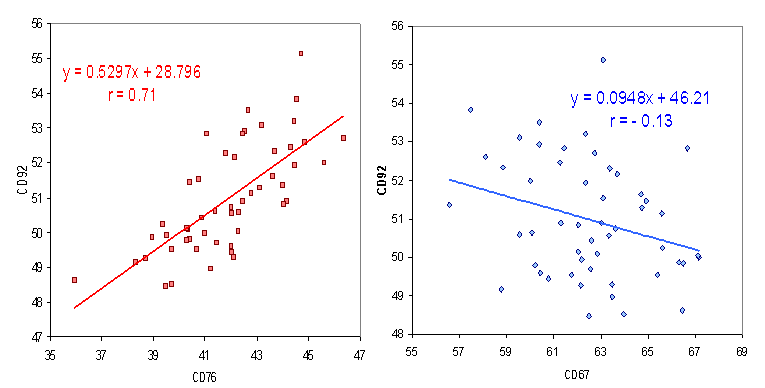 |
| Figure 1. Scatter plots and regression lines for temperatures between CD 92 and CDs 76 and 67 respectively. |
The correlation between CD 76 and 92 is fairly large, so, CD76 is a reasonable simple predictor of CD 92. In contrast the correlation between CD 76 and 92 is negative and quite small, so CD67 by itself is not much use in forecasting CD 92. The linear regression forecast equations and lines are shown in Figure 1. The coefficients for x (either CD76 or 67) are in this case close to the correlation, because these coefficients are defined as the correlation times the ratio of the standard deviation of the two temperature series. This illustrates the relationship between correlation and simple univariate regression.
REFERENCE
Dowdy, S., and Weaden, S, 1991, Statistics For Research, 2nd edition. John Willey & sons