Correlation is the measure of the linear statistical relationship between two random variables. The correlation coefficient r is computed using Equation 1.
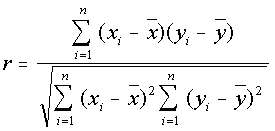 |
Equation 1 |
|
xi is
the individual observation in series x yi is the individual observation in series y n is the total number of observations |
|
The correlation can describe the linear relationship between (1) two different variables at the same locations, (2) the same or two different variables lagged in time, or (3) the same or two different variables separated in space, or (4) the same or two different variable lagged in time and separated in space. Examples of several of these are presented below.
The special case of (2) of a variable correlated with itself lagged in time is called the autocorrelation (or serial correlation). It is the correlation between members of a time series of observations, and the same values at a fixed time interval later (lag).
Example: autocorrelation with lag 1 (10) for daily time series within 1 calendar year means correlation computed using series x, which is the climate variable for January 1 through December 30(21), and series y, which is the same climate variable for January 2(11) through December 31.
REFERENCE:
Dowdy, S., and Weaden, S, 1991, Statistics For Research, 2nd edition. John Willey & sons