Climate Variables are time dependent variables: Each value has a time when this value took place. Simple way to look at climate time dependence is to plot the climate variable versus time (Figures 1 and 2)
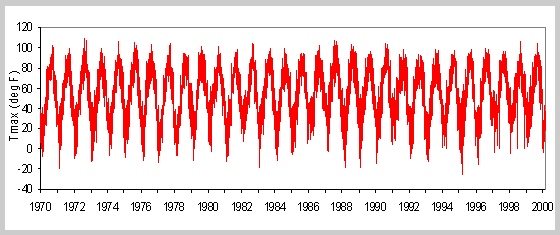 |
| Figure 1. Time Series Plot of Maximum Daily Temperature (degree F) at Bismarck, North Dakota |
The temperature time series (Figure 1) displays a pattern that resembles a sin/cosin function because of the annual cycle. There is also variability within each individual year and between years.
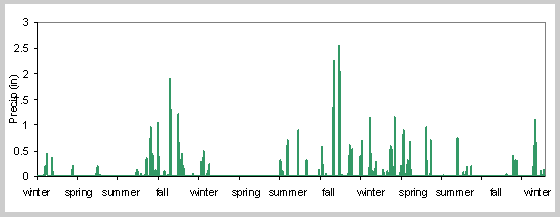 |
| Figure 2. Time Series Plot of Daily Precipitation (inches) at station Roosevelt, Arizona |
The precipitation time series (Figure 2) displays discrete character: Precipitation episodes interrupted by periods of dryness. In this example the annual cycle is less obvious. Precipitation amount vary within a year and between years.