Seasonal variability in climate time series is illustrated in Figures 1 though 3.
 |
|
Figure
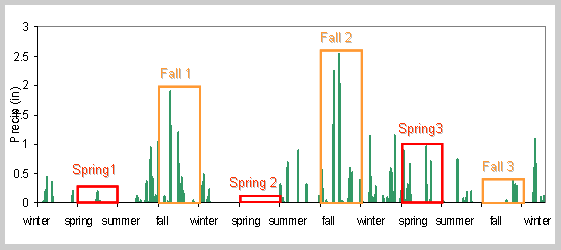
1. Seasonal Variability of Precipitation Series at Roosevelt lake,
Arizona. Boxes indicate 90 day time span in the horizontal and range
of precipitation amount during the 90 days in the vertical.
|
Three years (1971 -1973) of daily precipitation time series are shown in Figure 1. Boxes illustrate variability for spring and fall seasons within these three years. Comparing box heights indicates general greater range (variability) of precipitation amount during falls than during springs. Also there is a suggestion that spring precipitation is generally less than in fall.
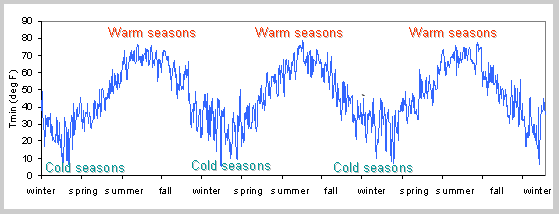 |
| Figure 2. Seasonal Variability of Daily Minimum Temperature for three years (1971-1973) at Central Park, New York |
Figure 2 shows three annual cycles of cold and warm seasons. Even visually it could be seen that the range of temperature fluctuations during cold seasons is greater than it is during warm seasons, i.e. intraseasonal variability of cold seasons is greater than that of warm seasons.
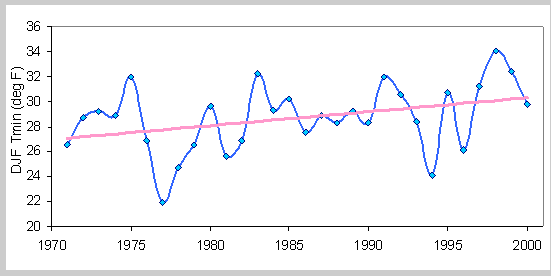 |
| Figure 3. Temporal Variability of Seasonal Averages (DJF) of Minimum Daily Temperatures at Central Park, New York With a Linear Trend Added. |
To analyze temporal variability of seasonal averages, all days within a cold season (example for DJF is shown in Figure 3) are averaged and plotted versus time. This plot illustrates interannual variability of the average temperature for the winter season.