National Weather Service Training Center
Basic Hydrology Concepts
Section VII
Steps in Forecast Preparation
Lesson Objective
The objective of this lesson is to describe the steps involved in producing a hydrologic forecast for a specific point.
Hydrologic Forecast Models
Forecast models simulate the hydrology for a river basin or reach. Consider a drainage area shown in the Alphabet River in the figure below. The objective of a forecast model is to make a forecast for the forecast point at headwater Gage A and downstream forecast point B.
The following are given:
Drainage Basin Map
API Diagram
The hydrologic computations to make a forecast include:
· Estimate or predict flow at Gage A.
· Route that water downstream to Gage B.
· Compute the flow from the local area for Gage B.
· Add the flow from the local area for Gage B to the routed flow to compute a storm hydrograph.
The local drainage for Gage B is that area below Gage A that drains to Gage B. Local drainage may be considerable if it includes any major tributaries.
Forecast Needs
Before creating the forecast, gather the following hydrologic information for the area:
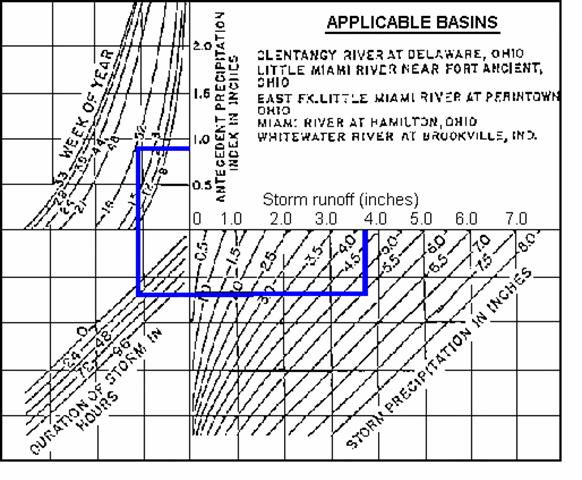
· API coaxial relationship for Headwater Basin A
· Unit hydrograph (UHG) for Headwater Basin A
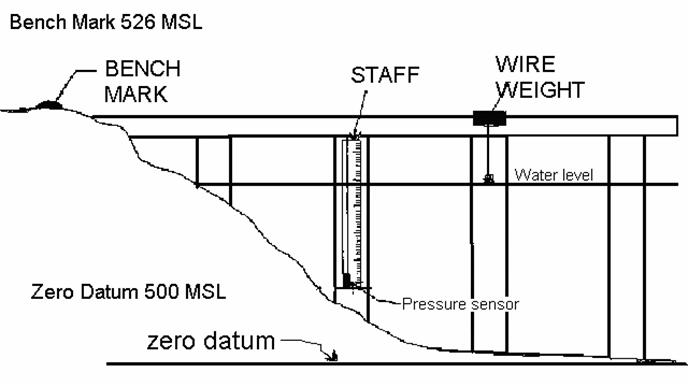
· Stage-discharge relationship or rating curve for Gage A
· Routing coefficients to route the water from Gage A to Gage B
· API coaxial relationship for the local drainage for Gage B
· UHG for the local drainage for Gage B
· Stage-discharge relationship or rating curve for Gage B
· Base flow in the river at both gages A and B
Steps in Computing Forecasts
To make a forecast at Gages A and B, complete the following steps:
- Using the API Model and based on rainfall, either from ground truth, radar, or both, estimate runoff for the headwater basin above Gage A for a particular time period or periods.
- Using the unit hydrograph and based on runoff from the API model (step 1), determine the total surface runoff hydrograph from the surface runoff for each time.
- Calculate the Total Discharge Hydrograph; compute the ordinates of the storm hydrograph by adding the base flow to the ordinates from the UHG operation (step 2).
- Calculate the Discharge/Stage Conversion; convert discharge (step 3) to stage to develop a stage hydrograph for Gage A.
Note: All of the computations for a single headwater point are complete, and one can make a forecast for Gage A. (In this exercise you are not expected to route the water to Gage B nor will you be given the parameters OR steps to route the water.)
Note: Use only steps (1 - 4) for the exercise presented here.
- Routing -- Route the storm hydrograph from Gage A (step 3) to Gage B.
- Using the API Model and based on rainfall, (either from ground truth or from radar) estimate the surface runoff for the local drainage for Gage B.
- Using the Unit Hydrograph and based on the runoff from the API model (step 6), determine the total surface runoff hydrograph from the surface runoff from the local drainage for Gage B.
- Determine the Storm Hydrograph; compute the ordinates of the storm hydrograph by adding the base flow for the local drainage for Gage B, the ordinates of the UHG operation for the local drainage for Gage B (step 7), and the routed flows (step 5).
- Calculate the Discharge/Stage Conversion -- Convert discharge (step 8) to stage to develop a stage hydrograph for Gage B.
This process produces forecasted hydrographs of discharge and stage at Gages A and B. The RFC hydrologists will use their knowledge of hydrologic models, hydrologic conditions, and rainfall patterns to adjust forecast hydrographs for Gages A and B and arrive at a forecast for the sites.
River forecast models used by RFCs employ the above computational techniques. When the hydrology warrants, RFCs will replace these simple techniques with more complicated ones. However, the general forecast procedure remains the same. There are some local applications programs available on personal computers to model parts of the hydrologic cycle. These applications usually employ manual data input and run very quickly at a WFO to support flash flood and flood forecast operations.
Hydrologic Exercise
Given:
Basin Map
API Figure
Rating Curve
Find:
Stage
Discharge
Time to Crest
Below is a sample hydrologic forecast. In the exercise that follows this example, you will have an opportunity to prepare a hydrologic forecast for Gage A, but will not be expected to route the water from Basin A to Basin B. The parameters to route the water from A to B are not given.
Sample Problem
1. It is 1200 UTC on March 1, and the Alphabet River basin has received heavy rainfall over the previous 24 hours. The average rainfall in inches for the basin is in the following table:
Headwater Drainage for A |
|||
12 – 18Z |
18 – 00Z |
00 – 06Z |
06 – 12Z |
1.00 |
0.50 |
2.00 |
2.50 |
Assume the API coaxial rainfall/runoff relationship is good for Basin A in the Alphabet River . Assume the soil is moderately moist with an API value of 1.5 for the headwater drainage A.
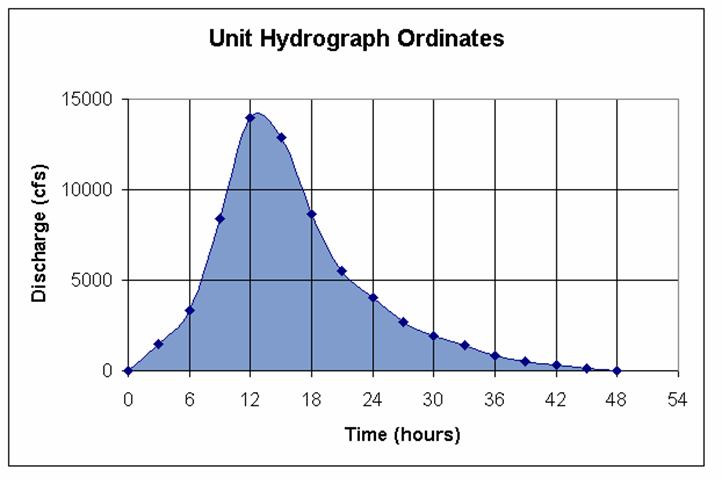
Based on previous work by a hydrologist, the ordinates in cfs of the six-hour unit hydrograph for each basin are:
Unit Hydrograph for Basin A |
|||||||
Time (hours) |
1 |
2 |
3 |
4 |
5 |
6 |
7 |
Flow (cfs) |
200 |
2000 |
1000 |
400 |
200 |
100 |
0 |
Assume the following:
- Baseflow for the A basin is 50 cfs
- Rating curve for Gages A is given above
- API value for computing runoff does not change during the storm
Challenge: Determine the forecasted stage and discharge hydrograph at Gage A. When is gage A forecasted to crest?
The calculations for each step as described above are in the sample problem below. The resulting forecasted discharge and stage hydrographs are given. The forecasted crest at Gage A would be about 23 feet occurring between 1200 UTC and 1800 UTC on March 1, or the morning of March 1.
Work through the answer until you feel you know how the forecast was prepared.
Answer to Sample Problem
BASIN A
|
|
Feb 28 |
|
Mar 1 |
|
|
|
12-18Z |
18-00Z |
00-06Z |
06-12Z |
Step 1 |
6 hr. rain (in) |
1.00 |
0.50 |
2.00 |
2.50 |
|
6 hr runoff (in) |
0.60 |
0.20 |
1.30 |
2.80 |
Computations for discharge at Gage A
Step 2 - Discharge from surface runoff
|
Feb 28 |
|
Mar 1 |
|
|
|
Mar 2 |
|
|
|
Mar 3 |
|
|
|
Mar 4 |
|
12Z |
18Z |
00z |
06z |
12z |
18z |
00Z |
06Z |
12Z |
18Z |
00Z |
06Z |
12Z |
18Z |
00Z |
RO from 12-18Z (cfs) |
0 |
120 |
1200 |
600 |
240 |
120 |
60 |
0 |
|
|
|
|
|
|
|
RO from 18-00Z (cfs) |
|
0 |
40 |
400 |
200 |
80 |
40 |
20 |
0 |
|
|
|
|
|
|
RO from 00-06Z (cfs) |
|
|
0 |
260 |
2600 |
1300 |
520 |
260 |
130 |
0 |
|
|
|
|
|
RO from 06-12Z (cfs) |
|
|
|
0 |
360 |
3600 |
1800 |
720 |
360 |
180 |
0 |
|
|
|
|
Baseflow (cfs) |
50 |
50 |
50 |
50 |
50 |
50 |
50 |
50 |
50 |
50 |
50 |
50 |
50 |
50 |
50 |
Step 3 Total flow at A (cfs) |
50 |
170 |
1290 |
1310 |
3450 |
5150 |
2470 |
1050 |
540 |
230 |
50 |
50 |
50 |
50 |
50 |
Step 4 Stage at Gage A (ft) |
7.5 |
8.0 |
15.8 |
16.0 |
21.0 |
23.0 |
19.0 |
15.5 |
12.0 |
9.5 |
7.5 |
7.5 |
7.5 |
7.5 |
7.5 |
Final Summary Exercise
Following are the six-hour basin average rainfall totals for headwater drainage for Gage A.
Headwater Drainage for Basin A |
||||
28 Feb – 1 Mar |
12 – 18Z |
18 – 00Z |
00 -06Z |
06 -12Z |
Flow (cfs) |
2.00 |
2.50 |
0.50 |
0.00 |
Using the hydrologic parameters in Sample Problem determine the time of crest, crest stage, and flow for Gage A.
You are not expected to know how to route the water from Gage A to Gage B, nor are the parameters given to route the water.
Exercise Worksheet
BASIN A – fill in values for the shaded blocks
|
|
Feb 28 |
|
Mar 1 |
|
|
|
12-18Z |
18-00Z |
00-06Z |
06-12Z |
Step 1 |
6 hr. rain (in) |
2.00 |
2.50 |
0.50 |
0.00 |
|
6 hr runoff (in) |
|
|
|
|
Computations for discharge at Gage A
Step 2 - Discharge from surface runoff
|
Feb 28 |
|
Mar 1 |
|
|
|
Mar 2 |
|
|
|
Mar 3 |
|
|
|
Mar 4 |
|
12Z |
18Z |
00z |
06z |
12z |
18z |
00Z |
06Z |
12Z |
18Z |
00Z |
06Z |
12Z |
18Z |
00Z |
RO from 12-18Z (cfs) |
|
|
|
|
|
|
|
|
|
|
|
|
|
|
|
RO from 18-00Z (cfs) |
|
|
|
|
|
|
|
|
|
|
|
|
|
|
|
RO from 00-06Z (cfs) |
|
|
|
|
|
|
|
|
|
|
|
|
|
|
|
RO from 06-12Z (cfs) |
|
|
|
|
|
|
|
|
|
|
|
|
|
|
|
Baseflow (cfs) |
|
|
|
|
|
|
|
|
|
|
|
|
|
|
|
Step 3 Total flow at A (cfs) |
|
|
|
|
|
|
|
|
|
|
|
|
|
|
|
Step 4 Stage at Gage A (ft) |
|
|
|
|
|
|
|
|
|
|
|
|
|
|
|
Answer for Exercise Worksheet
BASIN A
| Feb 28 | Mar 1 | ||||
| 12-18Z | 18-00Z | 00-06Z | 06-12Z | ||
| Step 1 | 6 hr. rain (in) | 2.00 | 2.50 | 0.50 | 0.00 |
| 6 hr run off (in) | 1.30 | 1.80 | 0.20 | 0.00 |
Computations for discharge at Gage A
Step 2 - Discharge from surface runoff
|
Feb 28 |
|
Mar 1 |
|
|
|
Mar 2 |
|
|
|
Mar 3 |
|
|
|
Mar 4 |
|
12Z |
18Z |
00z |
06z |
12z |
18z |
00Z |
06Z |
12Z |
18Z |
00Z |
06Z |
12Z |
18Z |
00Z |
RO from 12-18Z (cfs) |
0 |
260 |
2600 |
1300 |
520 |
260 |
130 |
0 |
|
|
|
|
|
|
|
RO from 18-00Z (cfs) |
|
0 |
360 |
3600 |
1800 |
720 |
360 |
180 |
0 |
|
|
|
|
|
|
RO from 00-06Z (cfs) |
|
|
0 |
40 |
400 |
200 |
80 |
40 |
20 |
0 |
|
|
|
|
|
RO from 06-12Z (cfs) |
|
|
|
0 |
0 |
0 |
0 |
0 |
0 |
0 |
0 |
|
|
|
|
Baseflow (cfs) |
50 |
50 |
50 |
50 |
50 |
50 |
50 |
50 |
50 |
50 |
50 |
50 |
50 |
50 |
50 |
Step 3 Total flow at A (cfs) |
50 |
310 |
3010 |
4990 |
2770 |
1230 |
620 |
270 |
70 |
50 |
50 |
50 |
50 |
50 |
50 |
Step 4 Stage at Gage A (ft) |
7.5 |
10.0 |
20.1 |
22.8 |
19.6 |
15.8 |
12.3 |
9.8 |
8.0 |
7.5 |
7.5 |
7.5 |
7.5 |
7.5 |
7.5 |
Return to the Basic Hydrologic Concepts Menu of Lessons.
Updated 07/18/07