

2.3 Analysis Methods
- Introduction
- Plots
- Spatial Data
- Data Viewer
 Analyzing hydrologic data is an easier task thanks to tools in the CHPS IFD.
Forecasters use Spatial Display, Plots, and tables to analyze data. You can open more than one Spatial Display and Plots tabs to assist you in the analysis task.
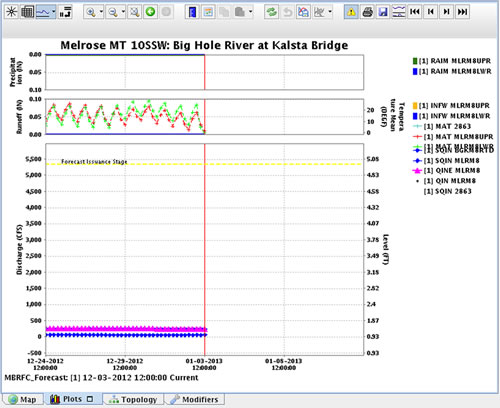 The Plots display is the primary analysis tool for hydrologic forecasters.
You can open more than one Spatial Display and Plots tabs to assist you in the analysis task.
Hint: Click the image to enlarge/shrink.
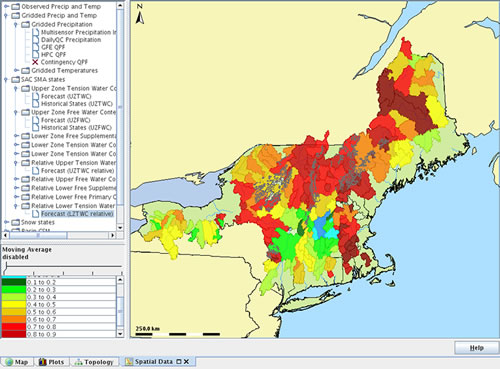 The Spatial Data plot gives an RFC-wide view of parameters.
This tab does not appear by default, so select this option from the Tools drop down menu.
Hint: Click the image to enlarge/shrink.
Note: The Spatial Display is view-only. You can locate sites with suspect data or model parameters, but must use the editing tools in the Plots or Modifiers tabs. Section 2.6 and 2.7 explore those options.
You can place your cursor over the display to get point values and the location name (typically configured for “value@location”) or you can click the “Labels” icon to overlay values.
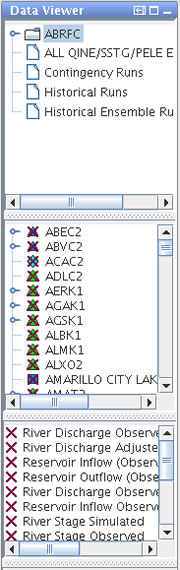 Data Viewer is a panel listing the data available for each location. This panel contains several boxes to help you systematically narrow down display choices.
For example, choose a basin from the top box, a location from the next one down, and finally, select a parameter to plot.
Hint: Click the image to enlarge/shrink.
Note: The icon representing the site flashes when you click it in the list if you are in the Map view.