

5.2 Purpose of Graphics Generator
Graphics Generator, a panel in the IFD, was developed to mimic the graphic-producing functionality of the Extended Streamflow Prediction Analysis and Display Program (ESPADP).
Before Graphics Generator
Any data in time series format can be ported to a graphic and converted to XML or tabular format and displayed/graphed.
Unfortunately, creating graphics required interaction with XML, specifically the DisplayGroups.xml.
How much interaction with XML? As an example, the DisplayGroups.xml for ABRFC is over 100,000 lines of code!
Graphics Generator
 Graphics Generator is not part of the original CHPS package.
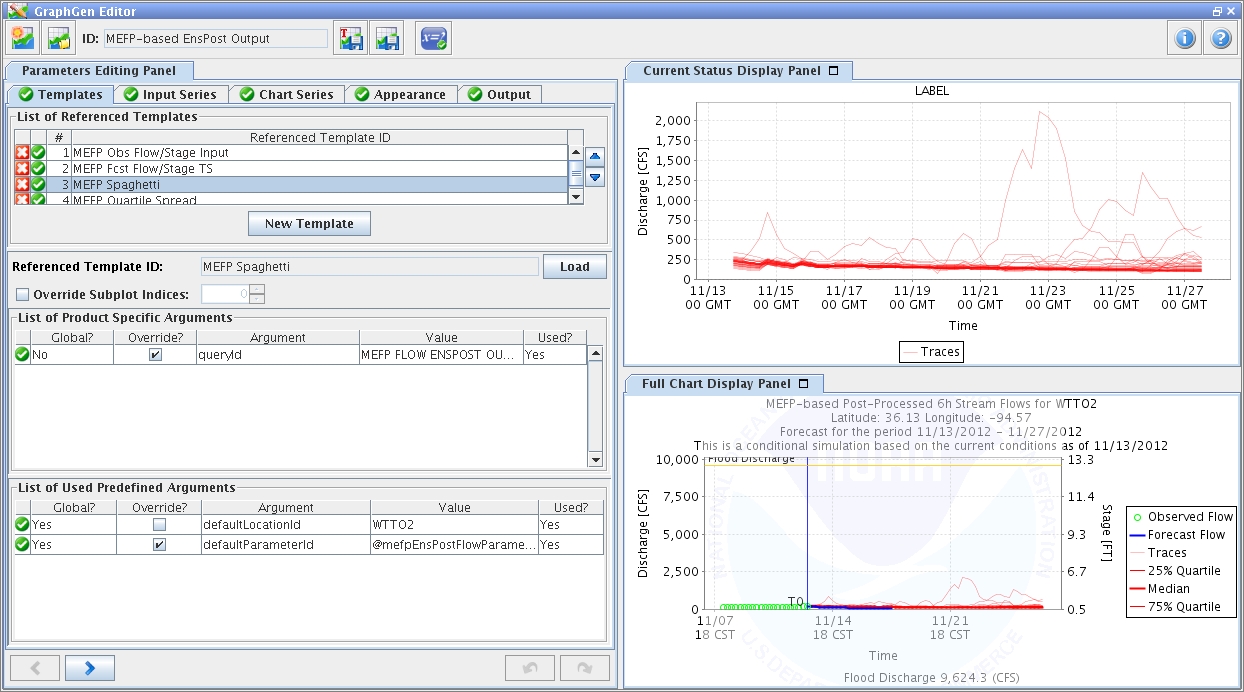
Graphics Generator can be configured to use as a CHPS IFD panel.
Hint: Click the image to enlarge/shrink.
Once Graphics Generator is configured, allows the user to output time series data to tables, graphics, or XML format without editing configuration files.
This lesson is an introduction to Graphic Generator’s capabilities.
We will also discuss the basic steps for adding the panel to the IFD.