

4.2 Time Series Display
The most commonly used display in CHPS is the Time Series Display. RFC forecasters use the interface to display and edit hydrographs (hydrologic data in time series format).
Functions
 The Time Series Display represents dynamic or historic data in graphical form.
Forecasters can view and edit data through this interface.
When the forecast is being edited, forecast and observed temperature, precipitation, stage, and pool elevation are typically displayed.
Data can be point data or gridded data (not spatial) and can be in any time step, although, six hour time steps are still the most common.
Display Features
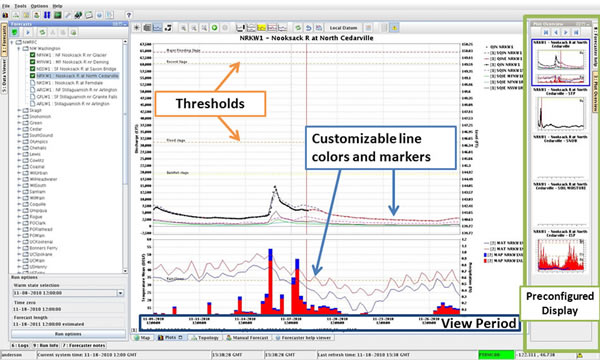
Click on the image to the right to see an example of a Time Series display.
Some configurable features shown in this display include:
- Pre-configured displays
- Thresholds, such as bankfull and flood stage
- Color and line weight
Reminder: The Time Series Display has many functions. Covering all of the available options is beyond the scope of this training.