

4.4 Time Series Configuration
The previous page introduced a few options for customizing the Time Series display.
Here are some specific configuration changes with a sample of the corresponding XML code.
Default View Period
The Default View Period defines the time span of data shown in the time series (unless overruled by the user).
![]() In the example to the right, the start time is 120 hours before the current time and 120 after.
In the example to the right, the start time is 120 hours before the current time and 120 after.
Time Markers
Time Marker settings include setting such as system time, display time, threshold, and forecast confidence.
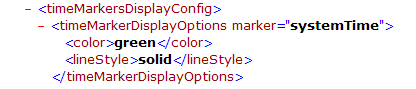
This example shows markers for the color and line style for system time.
Parameter Display
The Parameter Display defines a preferred default color, line width, and marker style.
Note: If a graph contains two traces of the same parameter (stage, for instance), the first stage trace listed in DisplayGroups.xml will use the preferred color in TimeSeriesDisplayConfig.xml and the second one listed uses the next color in the color palette.
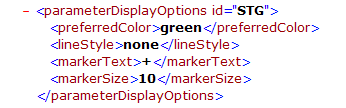
In this example, stage will be displayed as green plus signs with a size of 10 points (think font size) and no line.
Multiple Files
As mentioned on the previous page, multiple files can be edited to change the look of the Time Series Display.
All of the examples on this page are from TimeSeriesDisplayConfig.xml, the primary file for the layout of the display.
The other files governing the Time Series Display are:
- DisplayGroups.xml found in the SystemConfigFiles directory
- HistoricalEvents.xml located in the RegionConfigFiles directory
- Thresholds.xml and ThresholdValueSets.xml found in the RegionConfigFiles directory