Skew-T Traces
The following traces are plotted on the Skew-T:
Temperature (red solid line) - temperature of environment
Virtual Temperature (red dashed line) - temperature of environment incorporating moisture's affect on buoyancy to be consistent with gas constant (important for CAPE calculations and visualizing parcel traces)
Dewpoint Temperature (green solid line) - dewpoint temperature of environment
Wet Bulb Temperature (cyan solid line) - temperature of the air when cooled to saturation at constant pressure
Lifted Parcel with Virtual Temperature Correction (white dashed line farthest right) - the unsaturated and saturated parcel ascent from the chosen lifting method using the virtual temperature correction. All parcels are lifted dry adiabatically to their respective lifted condensation level (LCL), and then parcel ascent continues moist adiabatically to the level of free convection (LFC). The effects of ice or water loading on saturated ascent are not accounted for.
Lifted Parcel without Virtual Temperature Correction (white dashed line second from right) - the unsaturated and saturated parcel ascent from the chosen lifting method NOT using the virtual temperature correction. All parcels are lifted dry adiabatically to their respective lifted condensation level (LCL), and then parcel ascent continues moist adiabatically to the level of free convection (LFC). The effects of ice or water loading on saturated ascent are not accounted for.
DCAPE Downdraft Parcel (white dotted line on left) - the minimum ThetaE in the lowest 400mb is brought down moist adiabatically to the surface.
The following coordinates are also plotted on the Skew-T:
dry adiabats - grey blue dotted lines
moist adiabats - dark blue dotted lines
mixing ratios - green dashed lines
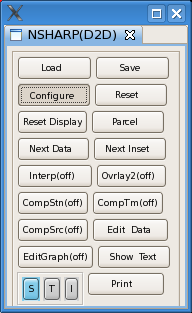
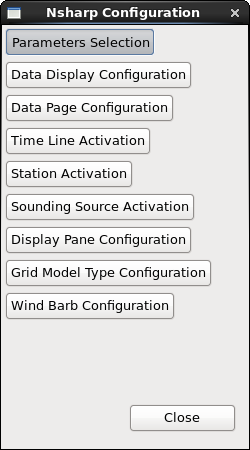
All the traces and coordinates in the Skew-T are toggled on/off with the "Parameter Selection" button accessible from "Configure" button in the D2D NSHARP button controls.