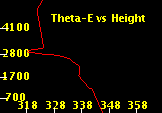
Theta-E vs Height
The equivalent potential temperature (theta-E) with height is plotted.
x-axis - theta-E (K)
y-axis - height (meters)
red line - environmental theta-E
Theta-E can be used to identify potential instability, and it can be used to predict damaging winds.
Theta-E differences > 25-30 K between the surface and mid-levels (3-6km AGL), indicate a significant potential for downdrafts (Atkins and Wakimoto 1991).