Icing
The Aviation Weather Center NSHARP icing displays have been integrated into AWIPS-2 NSHARP.
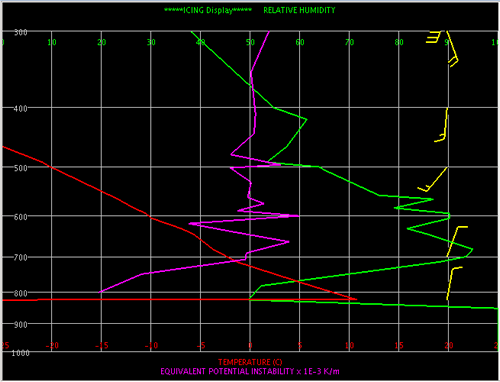
In the icing displays the data are plotted as follows:
Relative Humidity (%, green, top x-axis) - values > 85% are favorable for icing
Temperature (T, red, bottom x-axis) - values between 0C to -20C indicate supercooled liquid potential and are favorable for icing
Equivalent Potential Instability (x10-3 K/m, pink, bottom x-axis) - values < 0 indicate upward vertical motion and are favorable for icing