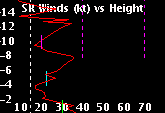
Storm-Relative Windspeeds vs Height
The storm-relative windspeeds versus height are plotted using the storm motion specified by the white icon (circle with plus sign) in the hodograph display. Note the user can specify a storm motion by left mouse clicking on the hodograph. The components of this display include:
x-axis - wind speeds with tick marks every 10 kts
y-axis - height (km)
white dashed straight line - the 15 kt storm-relative windspeed; values of 4-6km storm relative windspeed < 15kt have been associated with supercells that produce excessive cold outlfow
red trace - storm-relative windspeed
green line segment - 0-2km layer average storm-relative windspeed
cyan line segment - 4-6km layer average storm-relative windspeed
purple line segment - 9-11km layer average storm-relative windspeed
purple dashed straight lines - the storm-relative windspeeds between the two purple dashed lines indicate the range of upper-level storm-relative windspeeds generally associated with classic supercells