Equation 1 shows an autocorrelation model with lag 1 and error term represented as white noise. Such an autocorrelation model is called red noise, or a first order Markov process, or damped persistence. The latter term refers to the fact that as the correlation increases the equation approximates more and more closely persistence with some added noise. It represents a stochastic (noisy) process with some memory.
| Equation 1 | |
| x(t)
is the value of variable x
at time t 1 is the lag of the function rx (1) is the autocorrelation coefficient with lag 1 epsilon(t) is the value of white noise function at time t |
|
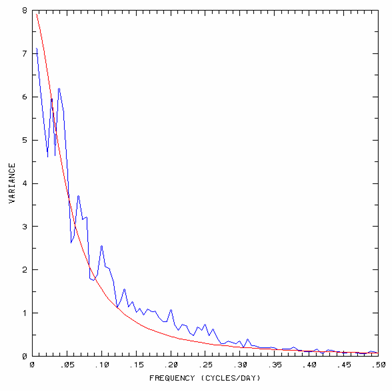
Spectrum of a red noise function is shown in Figure1. The red noise function was chosen to fit to 30 years (1971-2000) of daily anomalies of maximum temperature at Boulder, Colorado. Figure 1 also shows the temperature anomaly spectrum. The spectrum plot is characterized by increasing power at lower frequencies. This is the fundumental characteristic of red noise processes. You can see that the temperature series is fairly well represented by the red noise model.
 |
| Figure 1. Periodogram for red noise fitted to 30 years of daily anomalies of maximum temperature data at Boulder, Colorado. Picture courtesy of Klaus Weickmann, CDC OAR |