

5.3 Graphics Generator Interface
The Graphics Generator interface allows users to create, edit, and save templates to produce output.
Interface
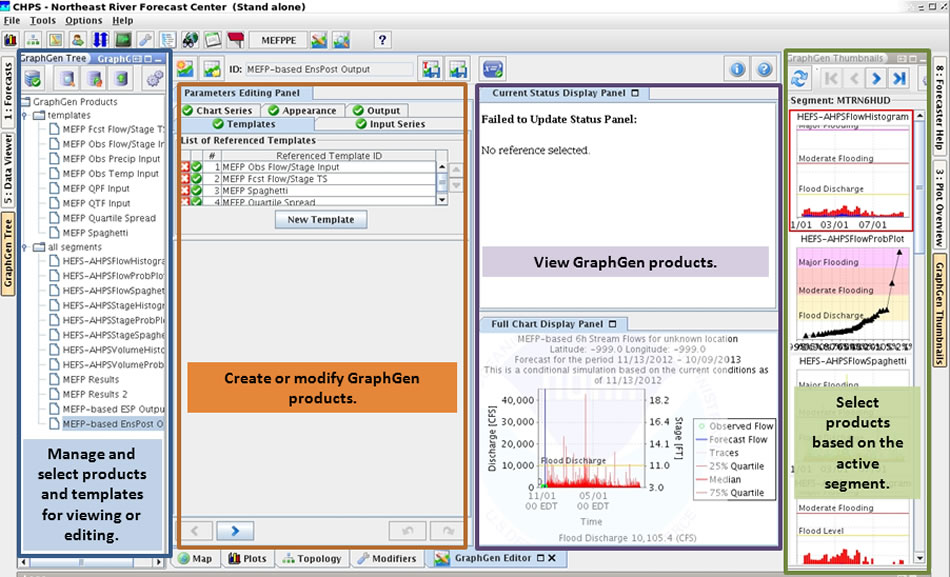
The image at right shows the main Graphics Generator screen.
Hint: Click the image to enlarge/shrink.
The interface has two options for selecting products:
- select a product from the left side of the interface, or
- choose a product based on the active segment in the forecast process.
Note: The panes within Graphics Generator cannot be moved.
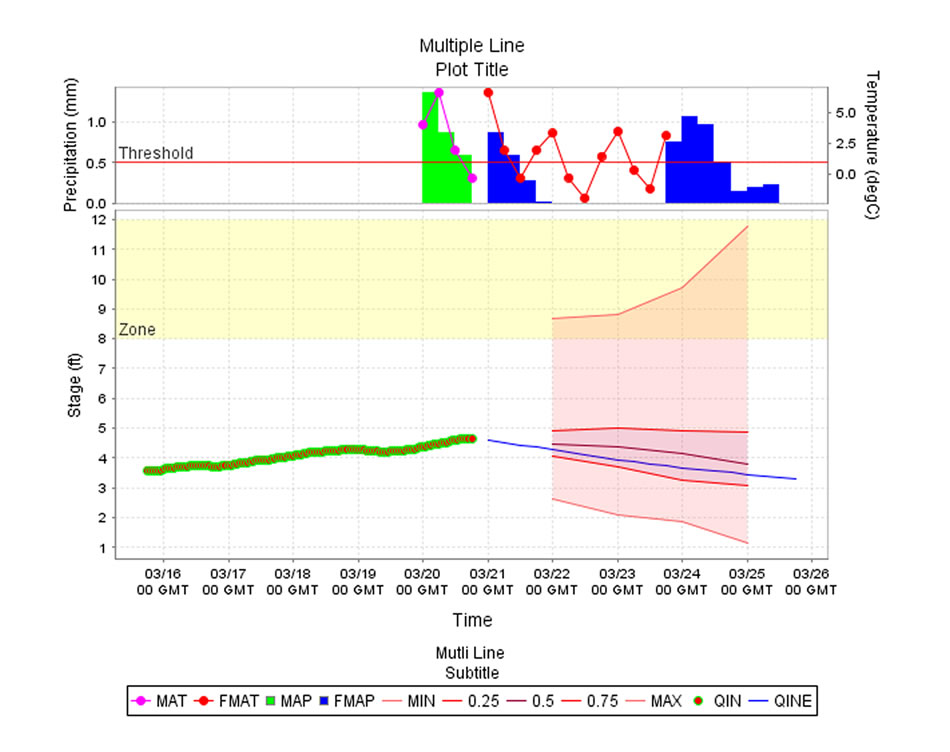
Graphics Output
Users can interactively build graphics, perform statistical analysis on the data, and change the appearance of the data.
Hint: Click the image to enlarge/shrink.
The graphics output could be used for the Advanced Hydrologic Prediction Service (AHPS) pages.
Graphics Generator can produce any type of output, as long as:
- the data is in time series format,
- the user created a template to format the information, and
- there is a plug-in to create it.
Note: This module does not contain instructions on how to create and save templates.
Reference: Graphics Generator Getting Started Guide