

{lessontitle}
3.2 Spatial Display
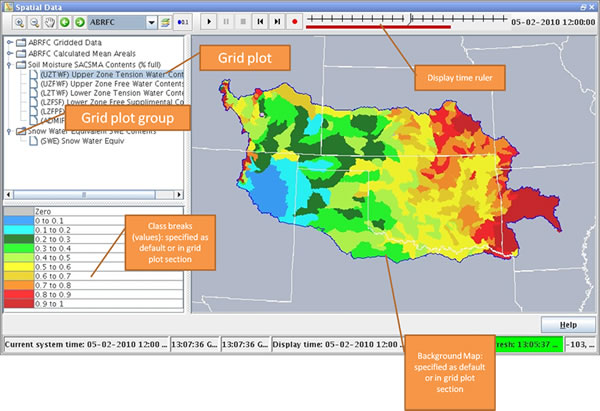 The Spatial Display is a powerful tool to display observed, simulated, or historical data on a map background over a specified period.
The Spatial Display window shows time series data of any type: scalar, polygon, or grid depicted on a map background.
Hint: Click the image to enlarge/shrink.
Example of Spatial Display Uses
The Spatial Display has many uses, including:
- depicting Flash Flood Guidance (FFG) values
- showing values for Water Supply Forecasts
- plotting forecast temperature and wind data help with timing of snow melt
- highlighting areas where the soil moisture values are not consistent with neighbors, an indicator of errors in the water stored in the model’s “buckets”